
Know Your Real Profit. Every Single Day.
A live P&L for your store that pulls every number — sales, ad spend, COGS, fees, chargebacks, fixed costs — into one dashboard. Daily and monthly views. No more waiting for your accountant.
Rated Excellent on Trustpilot Shopify
 WooCommerce
 BigCommerce
 Wix
Wix Squarespace
 Etsy
Etsy eBay
eBay Meta
Meta Instagram
 TikTok
 Google
 Google Analytics
 Stripe
 PayPal
 Mailchimp
 WhatsAppShopifyWooCommerceBigCommerceWixSquarespaceEtsyeBayMetaInstagramTikTokGoogleGoogle AnalyticsStripePayPalMailchimpWhatsApp
Revenue Is a Vanity Metric
Most store owners can quote their revenue. Almost none can quote their profit — today, this week, this month.
- ✓ROAS looks great in Ads Manager — but after COGS, shipping, fees, and chargebacks, the campaign loses money.
- ✓Your "profitable" month turns out break-even once fixed costs land.
- ✓You find out in March that December was your worst month. Too late to fix anything.
| Month | Total Sales | Marketing | ROAS | Real Profit | % Profit |
|---|---|---|---|---|---|
| Oct | $128,970 | $69,562 | 1.85 | $11,275 | 8.7% |
| Nov | $204,112 | $102,417 | 1.99 | $28,427 | 13.9% |
| Dec | $286,407 | $118,023 | 2.43 | $59,835 | 20.9% |
| Jan | $215,681 | $98,641 | 2.19 | $31,473 | 14.6% |
| Jul (LY) | $90,046 | $44,140 | 2.04 | −$10,589 | −11.8% |
One Dashboard. Every Dollar. Zero Manual Entry.
Full P&L Structure
Gross sales, discounts, returns, shipping, tax, marketing by channel (Meta, Google, TikTok, Bing), ROAS, real vs. estimated profit and COGS, transaction fees, chargebacks, reshipments, supplier disputes, apps, payroll, and fixed expenses. Nothing hides.
Daily + Monthly Views
Daily view for catching problems while you can still act. Monthly breakdown for trends, seasonality, and board-level reporting.
Automated Data Feeds
Connected directly to your store, ad accounts, and payment processors. Numbers update automatically — no VA copying data on a Sunday night.
Your Tool of Choice
Looker Studio, Google Sheets, or a custom dashboard. Built inside tools you already own — no new subscription.
The Metrics You'll Finally See
Live in Three Weeks
Audit
We map every money-in and money-out source: store, ads, processors, suppliers, apps, payroll.
Build
P&L structure built, feeds connected, 12–24 months of history backfilled.
Reconcile
Numbers checked against bank and processor statements so you trust them.
Train
Your team trained. You leave with documentation, not dependency.
One System. Every Part Connected.
Each piece stands on its own and gets stronger next to the others. See where this fits.
Overview
The complete operating system — how all six systems fit together.
View →Agentic Commerce
Get found — and get bought — inside ChatGPT and Google AI shopping.
View →Analytics & Tracking
Server-side tracking and attribution that iOS and ad blockers can't break.
View →AI Agents
Nine agents automating support, cart recovery, pricing, content, and returns.
View →Streamline Your Ecommerce Operations With Claude
Claude Code and Cowork on your store — bulk edits and theme changes in plain English.
View →Dedicated Expert
A named expert maintaining and improving everything, every week.
View →See the P&L dashboard on a real store.
Boots N Bags Heaven
AI Interactive P&L Dashboard
- The problem
- Revenue sat in two platforms, ad spend in four, and costs everywhere else — with no daily view of profit.
- What we built
- One automated P&L dashboard built inside the Google Sheets the team already worked in.
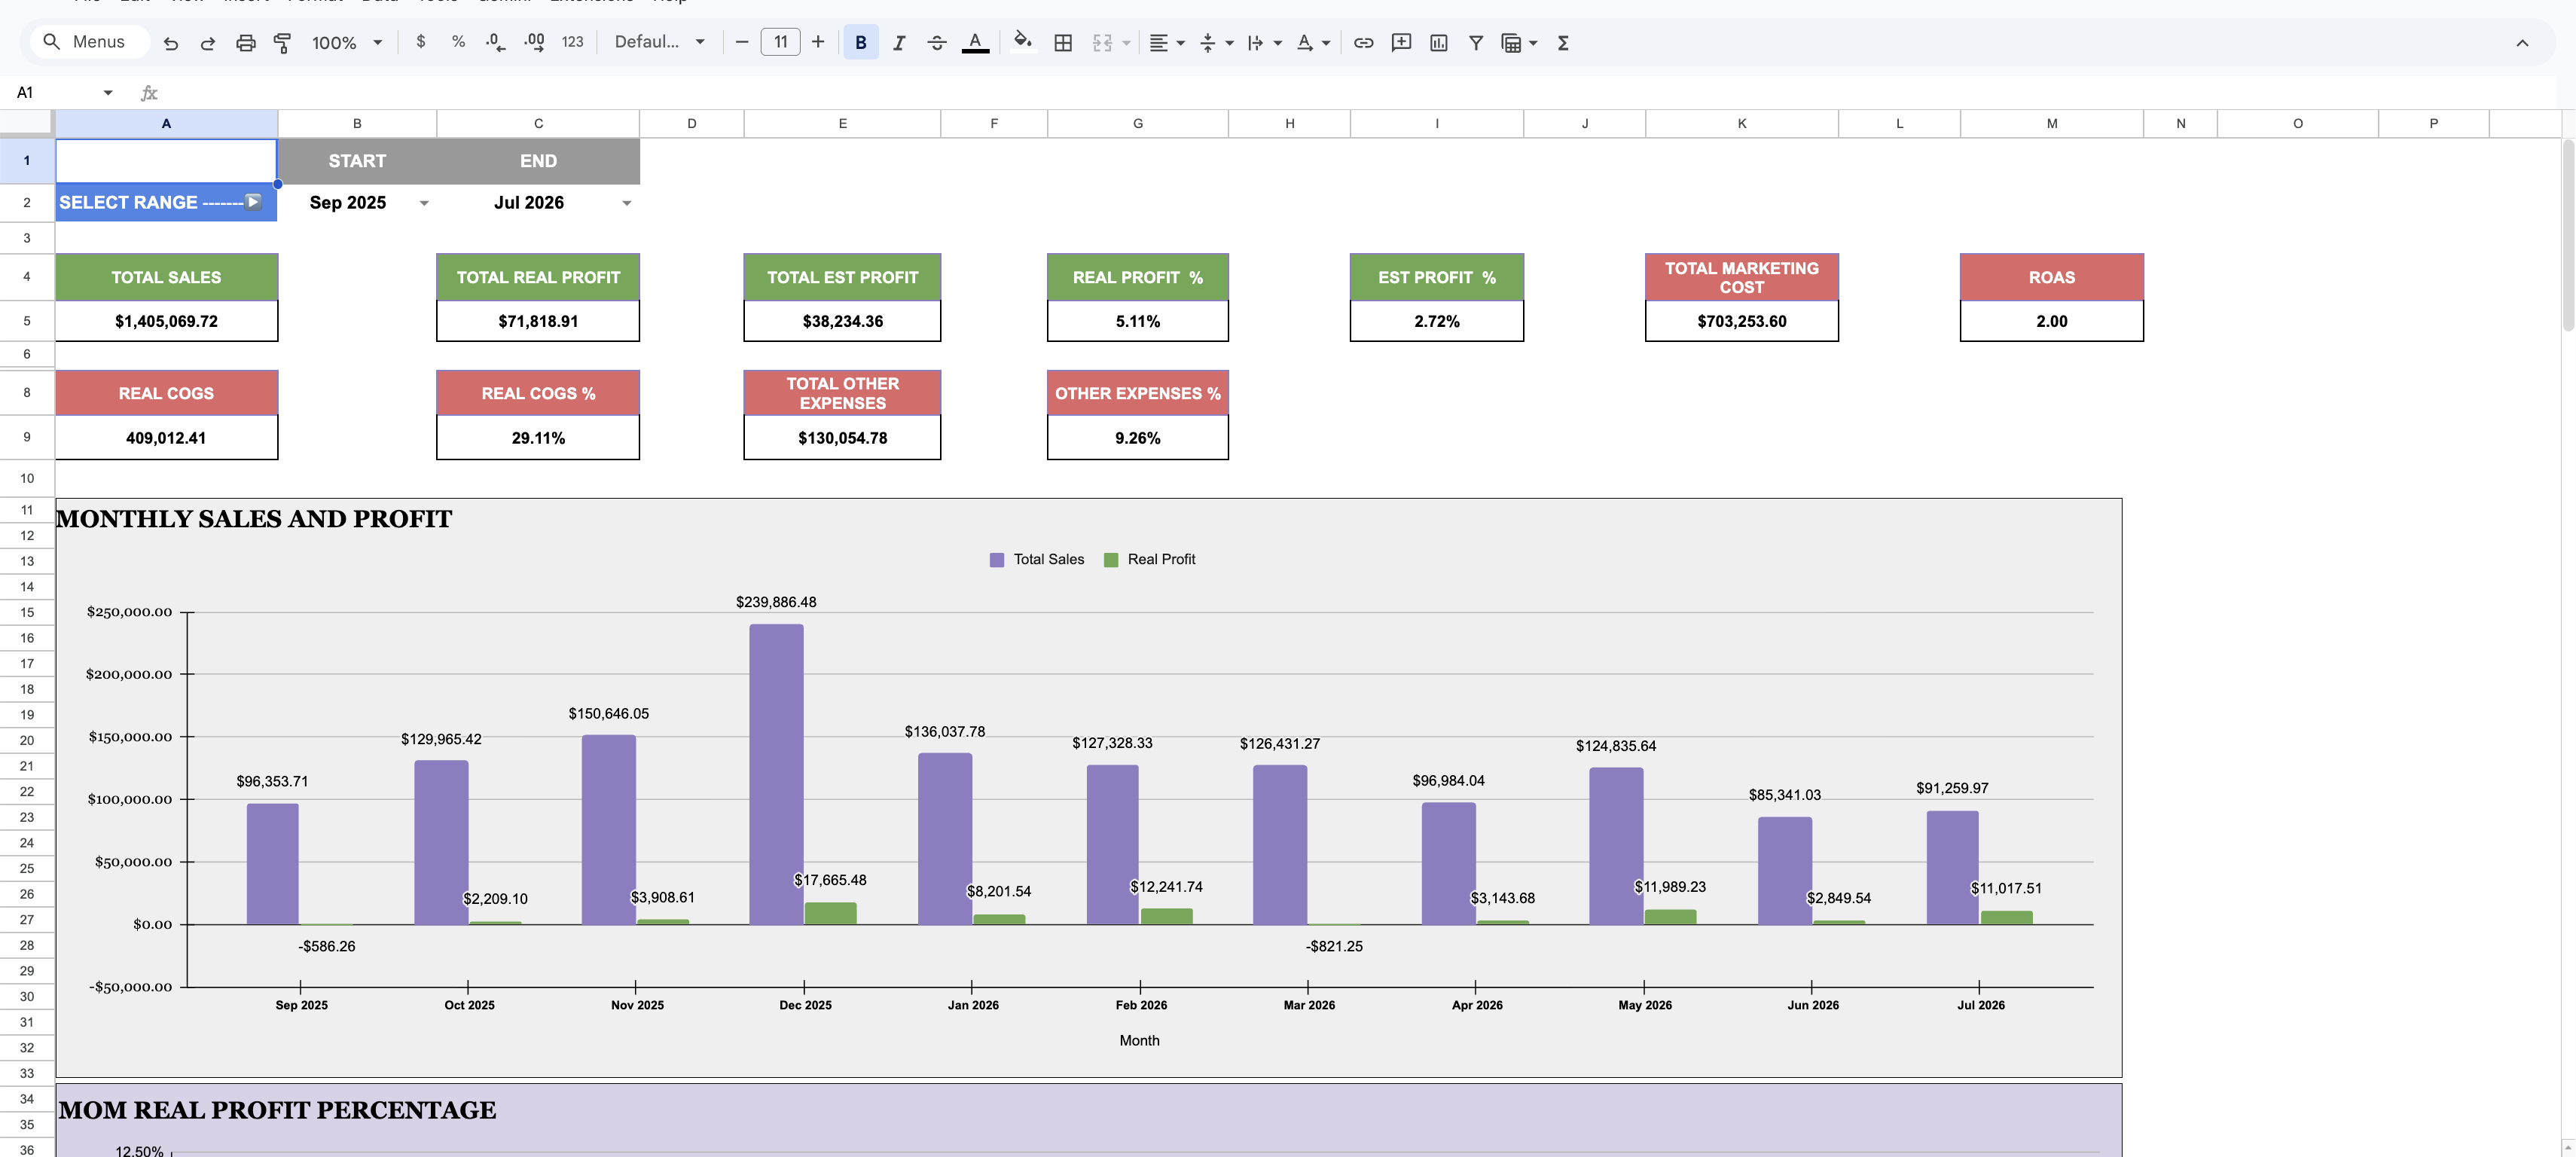
- Sales & spend in one P&L
- Before6 sources, reported separatelyAfter1 dashboard, updated daily
Book a call
Stop guessing your profit
Book a call and see a live sample dashboard built on real (anonymized) store data.