Automated dashboards & reporting
Dashboards built for you. Reports that turn up on their own.
We build the dashboards, and the daily, weekly and monthly reports that come off them. Built on the tools you already use, so the numbers agree with each other and arrive on a schedule instead of waiting for someone to go looking.
Rated Excellent on Trustpilot
Trusted by founders and leaders at 185+ growing companies
 K Charles
 McIntyre Inc
 Reporting Hub
 Suntiff
 REHQ
REHQ Cadre AI
 ViB Tech
 Good2beSocial
 Get Trained AI
 Hustle20
 Collectiv Academy
 Easy Street Offers
 Gobel Group
 Digital Diabetes
 LearnBrands
 PureNSM
 Uncommon Agency
 Euka AI
 Alphaline Tiny Homes
 BetterFleet
 Garner Bio
 Sports Plus Team
 Joshua Trees Experts
 Nueways Studio
 All State Game
 Digital Momentum
 Compound Fitness
 One Base Health
 Pop Events Co
 Bayaan Academy
 Hemlane
 Farotech
 TechForGood
 Naked Pools
 Rocket SaaS
 Crown Workforce Management
 Barcliff Group
 Hermetic AI
 Performativ
 Beeontrade
 JCI InstituteK CharlesMcIntyre IncReporting HubSuntiffREHQCadre AIViB TechGood2beSocialGet Trained AIHustle20Collectiv AcademyEasy Street OffersGobel GroupDigital DiabetesLearnBrandsPureNSMUncommon AgencyEuka AIAlphaline Tiny HomesBetterFleetGarner BioSports Plus TeamJoshua Trees ExpertsNueways StudioAll State GameDigital MomentumCompound FitnessOne Base HealthPop Events CoBayaan AcademyHemlaneFarotechTechForGoodNaked PoolsRocket SaaSCrown Workforce ManagementBarcliff GroupHermetic AIPerformativBeeontradeJCI Institute
The real problem
More dashboards did not make it clearer.
Here is how it usually goes. You bought the tools. Somebody built a dashboard. For a while people looked at it. Then sales quoted one revenue number, finance quoted another, and everyone quietly went back to their own spreadsheet. Now you have dashboards nobody opens and numbers nobody trusts.
The problem was never the charts. It was that the data underneath them did not agree, went stale, or was stitched together by hand every month.
72%
of users regularly abandon dashboards and go back to spreadsheets
Luzmo, State of
Dashboards 2025
25%
average share of staff actively using their BI tools, flat for seven years
BARC & Eckerson
Group
67%
of organizations do not fully trust their own data for decisions
Precisely & Drexel
LeBow, 2025
94%
of business spreadsheets audited contained at least one error
Panko, EuSpRIG
research
What we build
The reports a business actually runs on.
Revenue & profit
What you sold, what it cost you, and what you actually kept. Updated daily instead of at month end.
Sales pipeline
What is coming, what is stuck, and whether you are going to hit the number this quarter.
Marketing & ad spend
What every channel costs and what it brings back, side by side, without three logins.
Operations
Orders, fulfillment, capacity, and the one bottleneck quietly slowing everything else down.
Finance & cash
Cash in, cash out, and what is owed to you, without waiting on the bookkeeper.
Executive summary
One page. The five numbers that decide your week. In your inbox Monday morning.
Before / after
From hunting for numbers to reading
them.
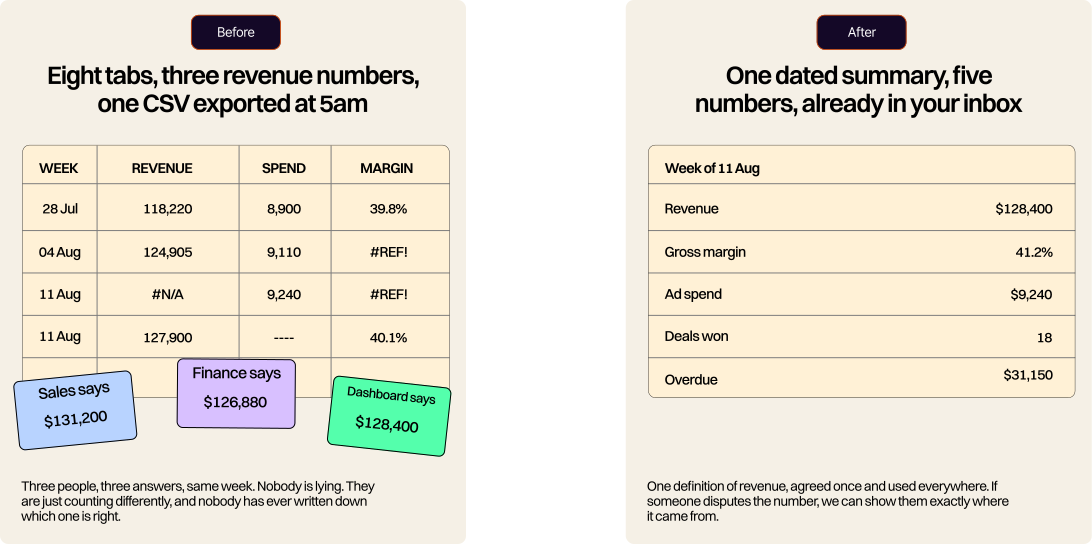
Representative illustration of the output we build. Not a specific client's data.
Why ours get opened
A report you have to remember to open is a report nobody opens.
Most dashboards fail for a boring reason. Somebody has to log in, click around and go looking. So they do not. We flip it round. Your numbers come to you: a short summary in Slack or email on a schedule, a PDF for the board pack, an alert the moment something crosses a line you care about.
The dashboard is still there when you want to dig into something. You just do not have to go hunting to find out that something is wrong.
Daily, weekly, monthly
Some numbers you need every morning. Some only once a month.
A dashboard is one thing. What makes it useful is the rhythm around it. We build the view, then set the reports that come off it on the schedule each audience actually needs, so nobody is reading numbers at the wrong frequency.
Live
Refreshes every few minutes
Orders, jobs and stock as they happen. Built for the screen on the ops wall, or the tab someone keeps open all day.
For: operations, warehouse, front desk
Daily
In Slack at 07:00
Yesterday in five numbers. What you sold, what came in, what is running low, and anything that broke overnight.
For: founders, managers, ops leads
Weekly
Email and Slack, Monday 07:00
Orders, jobs and stock as they happen. Built for the screen on the ops wall, or the tab someone keeps open all day.
For: leadership team, department heads
Monthly
PDF, built on the 1st
The board pack, done for you. Full profit view, channel and cohort performance, formatted and ready to send rather than rebuilt by hand.
For: board, investors, accountant
Every action that changes something waits for a human to approve it. Claude proposes, you confirm. Nothing irreversible happens on its own, and nothing gets sent without someone reading it first.
What changes
What "sorted" looks like.
The reporting cycle
Before
Two days of someone's month lost to copying, pasting and reconciling in spreadsheets.
After
One agreed definition, one figure, everywhere. The argument stops being about the data.
One set of numbers
Before
Sales, finance and operations each quoting a different revenue figure in the same meeting.
After
One agreed definition, one figure, everywhere. The argument stops being about the data.
Time to know
Before
You find out about a problem at month end, three weeks after it actually started.
After
An alert lands the day it happens, while it is still small enough to do something about.
These are representative outcomes based on the kind of work we do. They illustrate the change rather than claiming numbers from a named client. Much of this work sits under NDA and contains real financials, so we do not publish client figures without written permission. 180+ implementations delivered - 25+ specialists across Sydney, the United States and Pakistan - Rated Excellent on Trustpilot.
The tool question
We do not sell you a tool. We build inside your stack.
There is no single best dashboard tool. Which one is right depends on six things: how much data you have, how many places it lives, who needs to read it, how often it has to refresh, how tightly it needs governing, and your budget. Most agencies pick the one they happen to know. We start from what you already run, and we will tell you when the honest answer is a spreadsheet.
Dashboards & BI
Reporting inside tools you already own
The plumbing underneath
How it goes
A clear path from mess to Monday morning.
Agree the numbers
Model how the business actually makes and loses money. Boil down what each metric means, so 'revenue' means one thing everywhere.
Audit the data
Map out where every number really lives and find out what is duplicated or does not match. This is where those projects usually succeed or fail.
Connect and clean
Build automated pipes and where it is needed, fix it inside your database so nothing depends on a manual export.
Build it
The dashboard (and the scheduled reports, built on the metrics we agreed in step one) rather than to whatever the tool makes easy.
Check it against numbers you trust
Every figure gets validated against something you already know is right, before a single person relies on it. Trust is easily lost.
Roll out and train
We hand it over to your team actually used it, with the documentation to change it themselves later.
Keep it alive
Sources change, tools update, questions evolve. We keep it working so it does not quietly rot the way the last one did.
A focused first engagement is usually weeks rather than months. Custom connectors and bigger stacks add time. We scope first, then quote, because no two stacks are the same and a fixed package would only be honest for one of them.
Is this you?
You do not need a data strategy. You need to trust your Monday numbers.
You will know this is for you if any of the following happened in the last month.
You have dashboards. Nobody opens them.
Two people quoted two different revenue numbers in the same meeting, and both were sure.
Month end eats two days of somebody's life in spreadsheets.
The person who built your last dashboard left, and it has been frozen ever since.
You found out about a problem three weeks after it started.
Someone told you "we need Power BI" and you have no way to judge whether that is right.
You have plenty of data and still cannot answer "how are we doing?" without opening four tabs.
If you nodded at two of those, a call is worth half an hour.
FAQ
The questions we hear most.

CONTACT US
LET'S FIGURE OUT
YOUR AI
Our Platform Partners
Every platform we build in has vetted us. None of this is self-declared.