- Customers
- 100,000+
- Catalog
- 8,000+ products across clothing, footwear, bags, jewelry and accessories
- Sales channels
- 2 — Shopify store and Amazon
- Ad platforms
- 4 — Facebook, TikTok, Google and Bing
- Engagement
- AI Interactive Dashboard + Automation
Overview
Boots N Bags Heaven (BNB) is a US-based women's fashion brand — one of the fastest-growing in the country, with 100,000+ customers and a catalog of 8,000+ products across clothing, footwear, bags, jewelry, accessories and hair extensions. They sell through their Shopify store and Amazon, ship worldwide from multiple warehouses, and drive growth with paid ads on Facebook, TikTok, Google and Bing.
The team worked in Google Sheets every day. Rather than force new software on them, we built the entire system inside Sheets — and automated everything around it.
Challenge
Every number mattered. No number was in one place.
- Revenue split across two platforms. Shopify told half the story, Amazon told the other half. Combined daily revenue existed in nobody's dashboard — only in someone's head, on a good day.
- Ad spend split across four platforms. Facebook, TikTok, Google and Bing each reported their own spend and their own ROAS — each claiming credit, none showing what was actually profitable after costs.
- Costs scattered everywhere. Employee costs, subscriptions, returns, taxes, chargebacks, supplier disputes, transaction fees and reshipments — real money leaving the business, tracked nowhere together.
- No daily answer to the only question that matters. “What did we actually make yesterday?” had no answer. Profit was something the team discovered at the end of the month — when it was too late to change anything.
Solution
An AI interactive dashboard, in the tool they already lived in.
- Every source, connected. Automations pull Shopify and Amazon orders plus Meta, Google, TikTok and Bing spend into the dashboard — updated daily, no copy-paste, no VA.
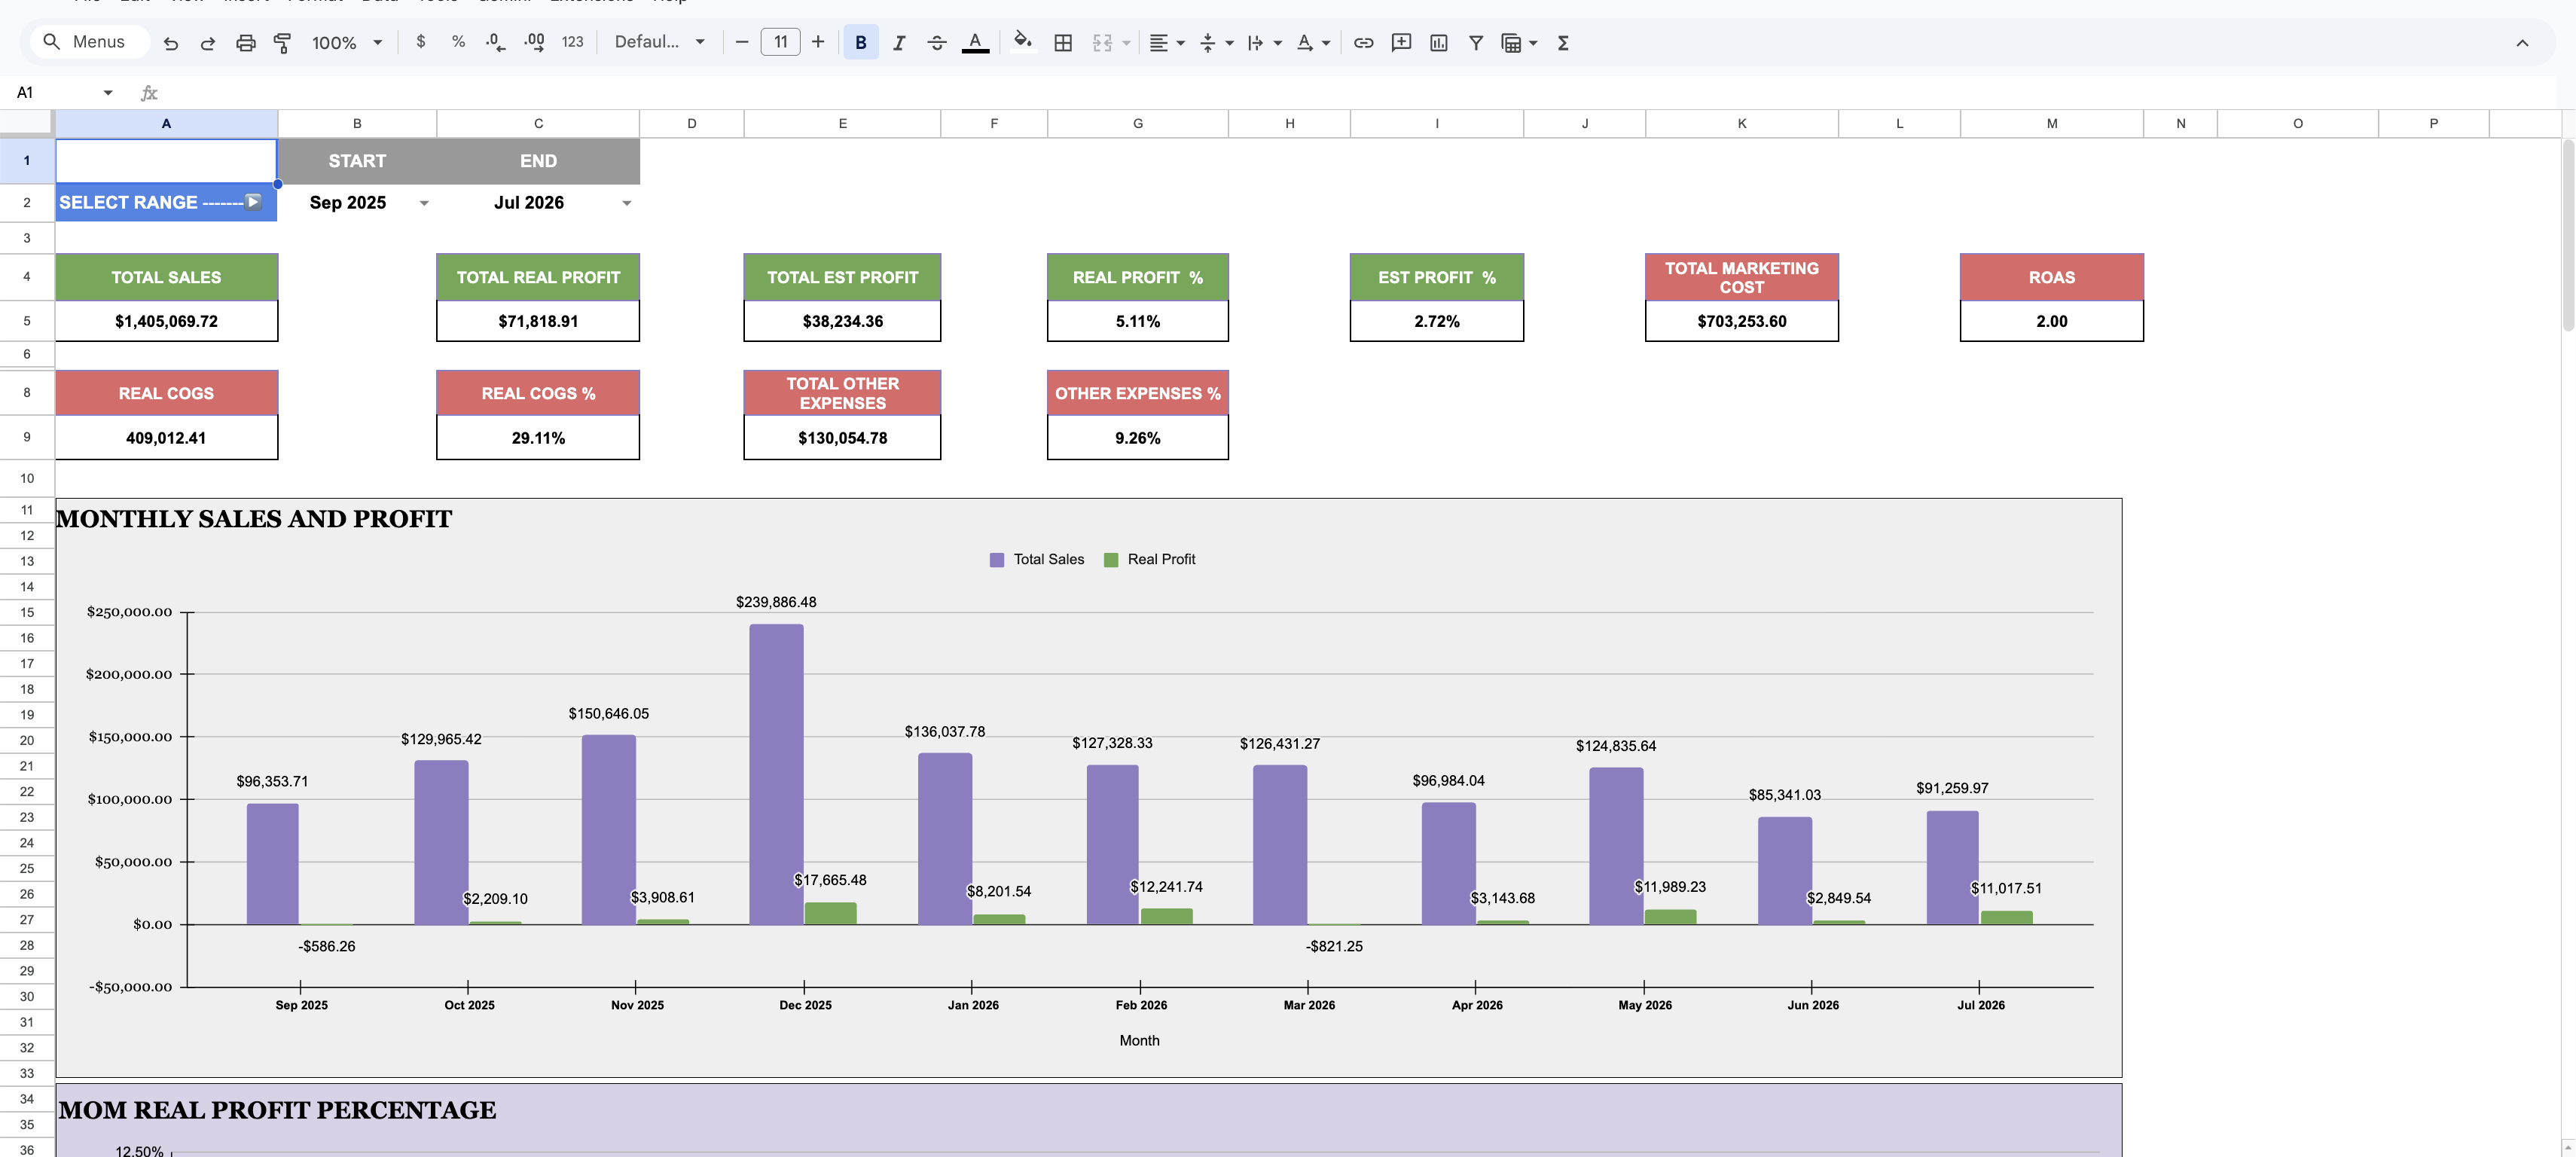
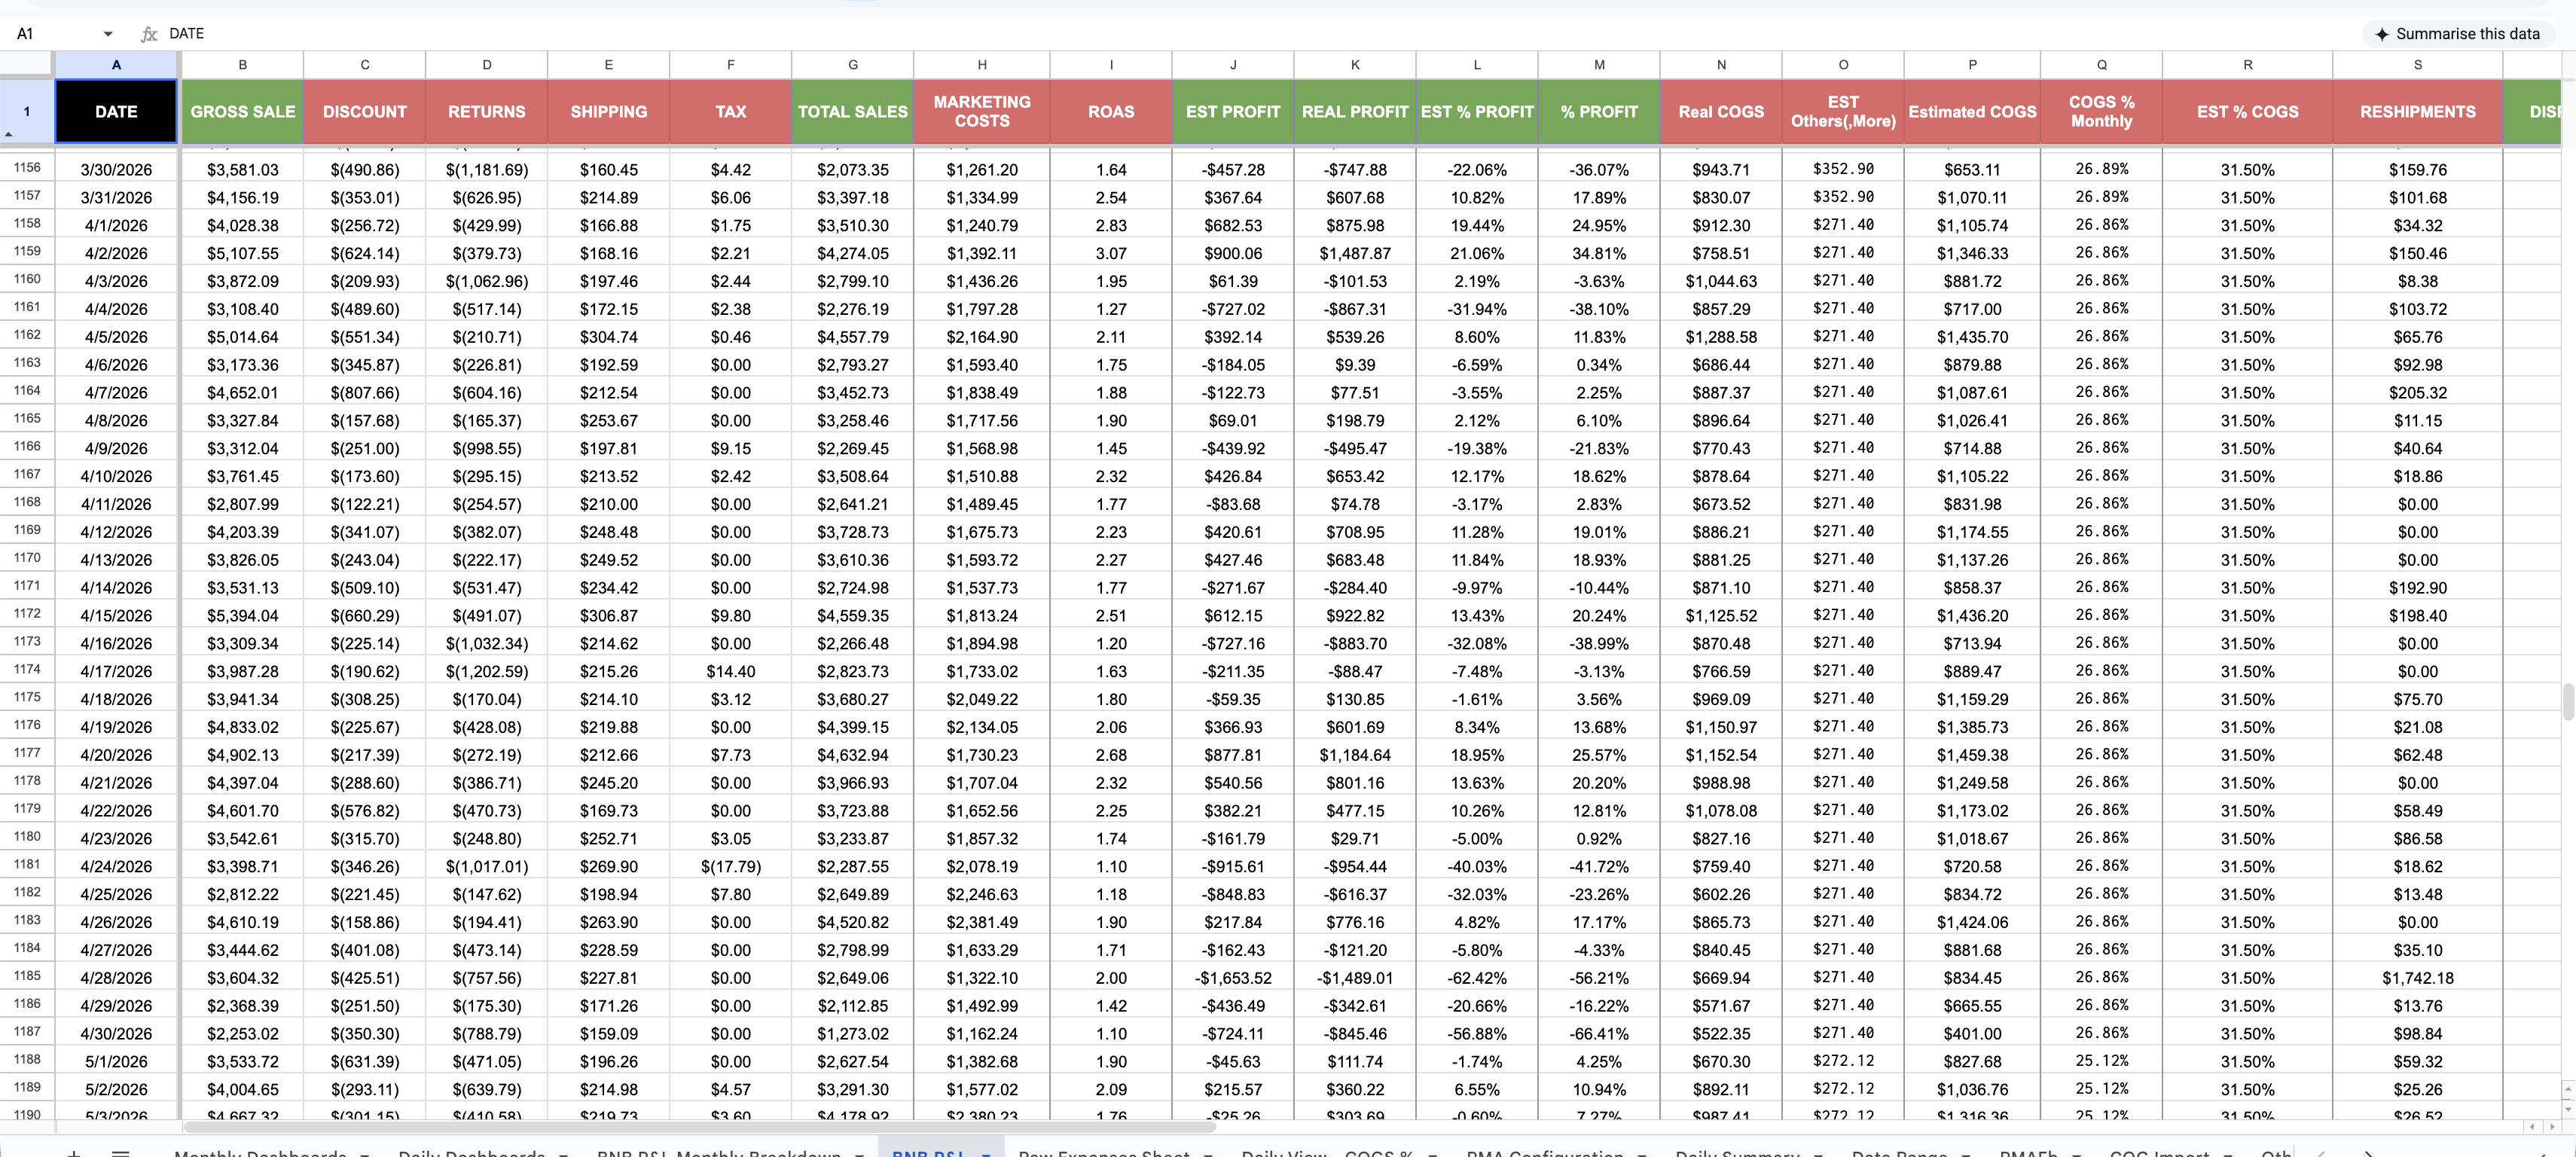
- ROAS and profit, calculated daily. Gross sales, discounts, returns, shipping, tax, marketing costs, COGS and fees — netted into real ROAS and real profit for every single day, automatically.
- Daily and monthly views. A daily P&L for catching problems while they are still fixable, and monthly dashboards with an interactive date-range selector for trends and seasonality.
- The full cost picture. Returns, taxes, chargebacks, supplier disputes, transaction fees and reshipments — every leak tracked, not just the flattering numbers.
- One place for manual costs. A simple entry system for employee costs and subscriptions, segregated by type — the team adds them once, the dashboard does the rest.
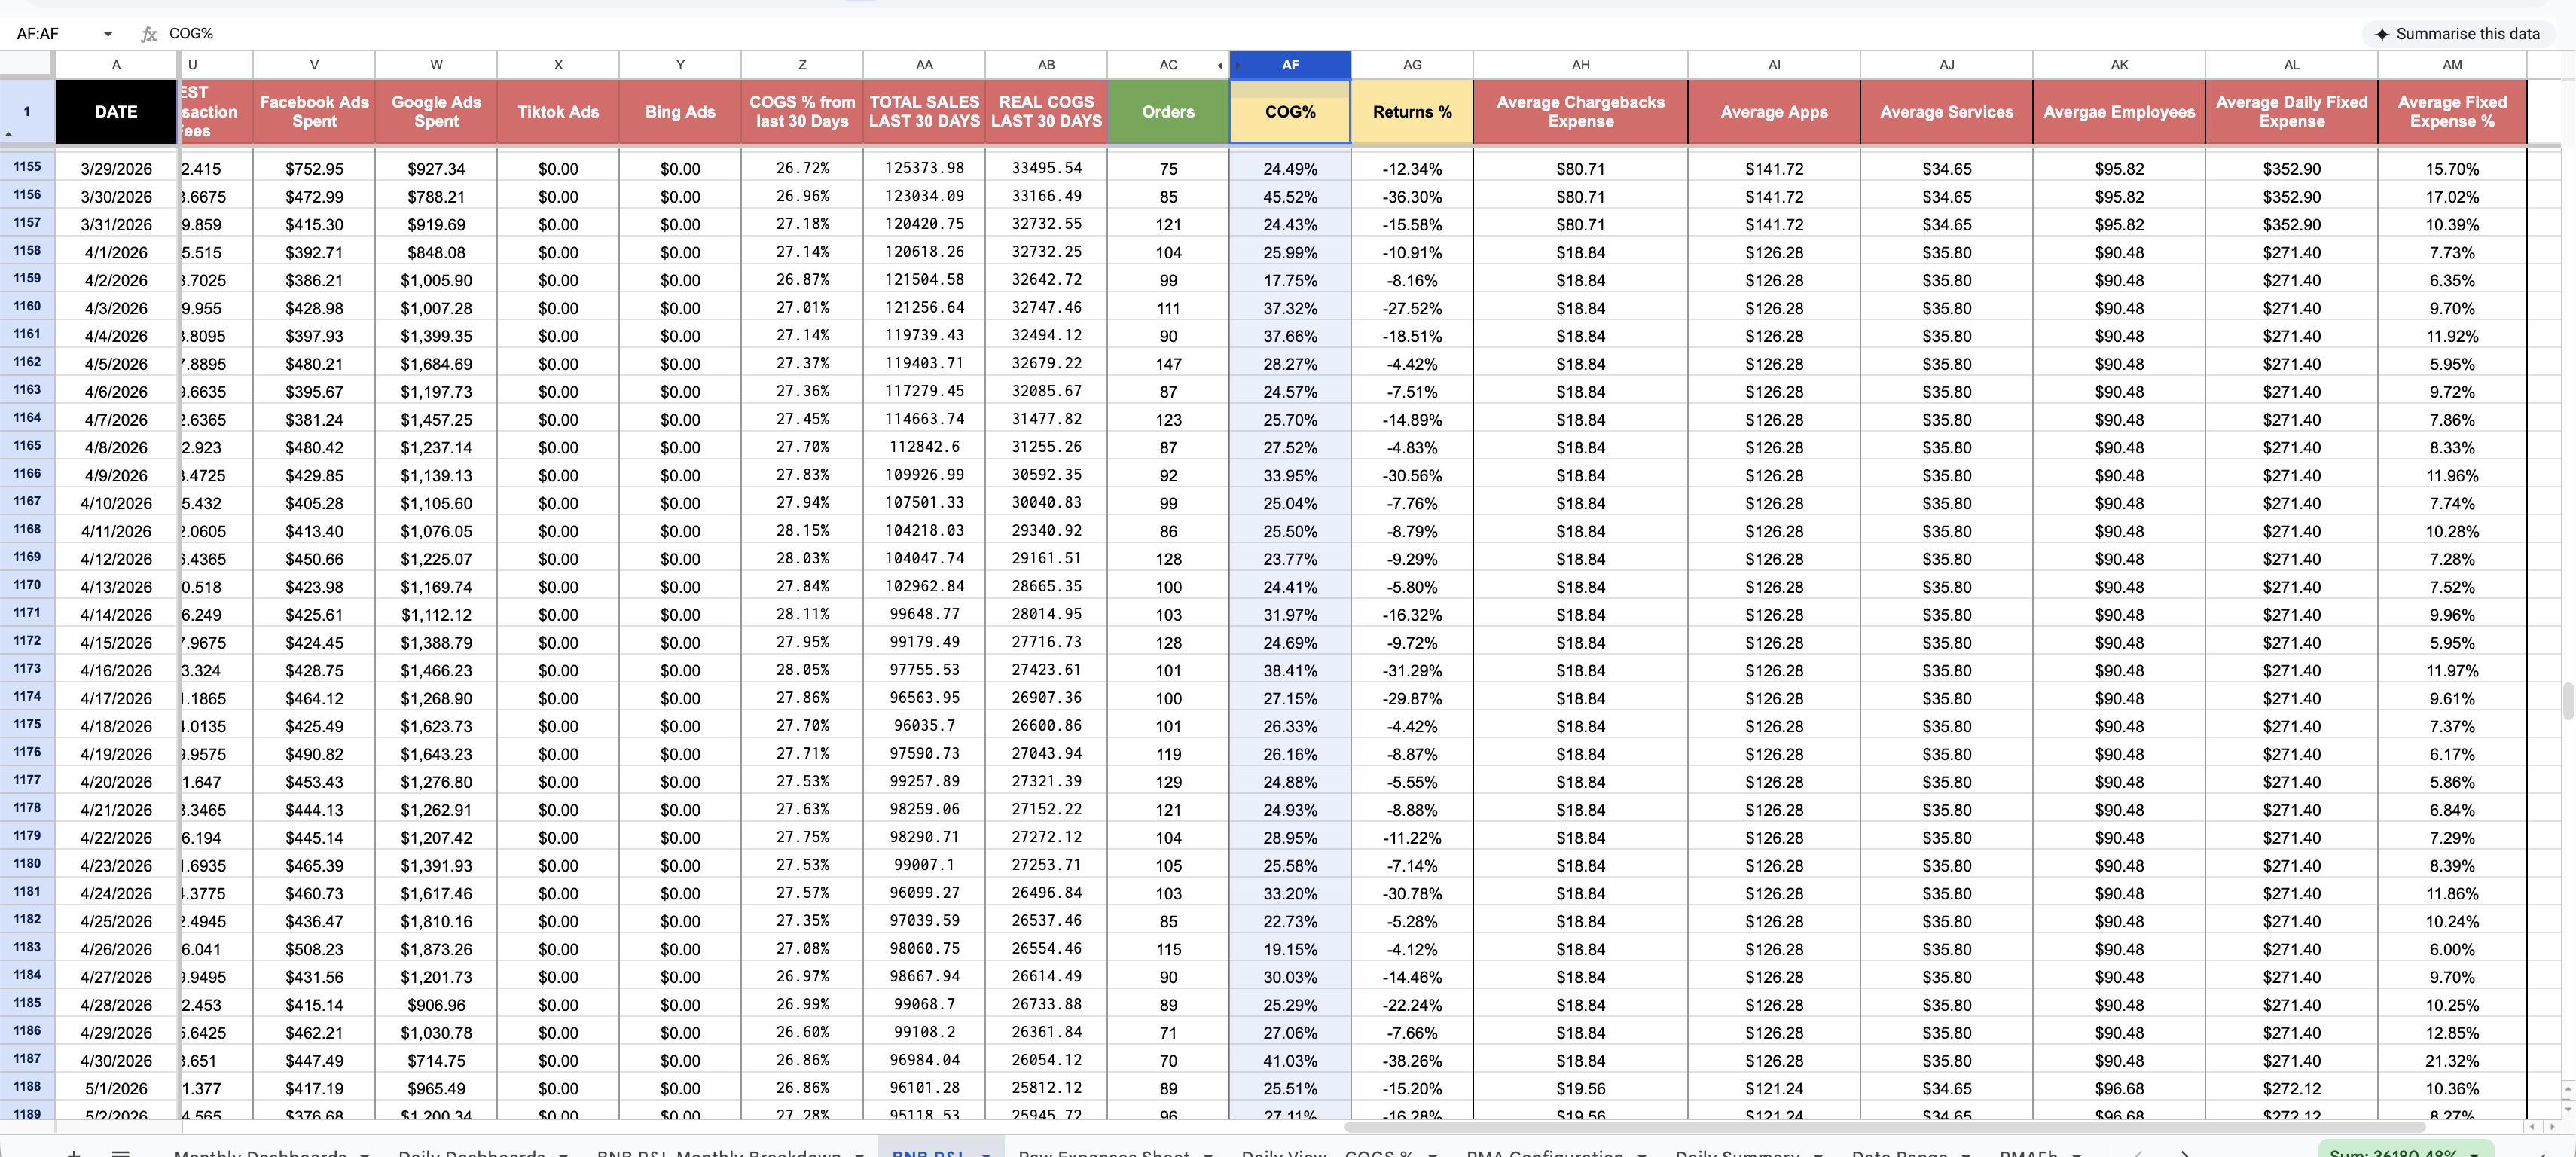
- A last-30-days pulse. A rolling 30-day metrics view — sales, real profit, COGS %, marketing cost — so the current state of the business is never more than one glance away.
Tracking every leak
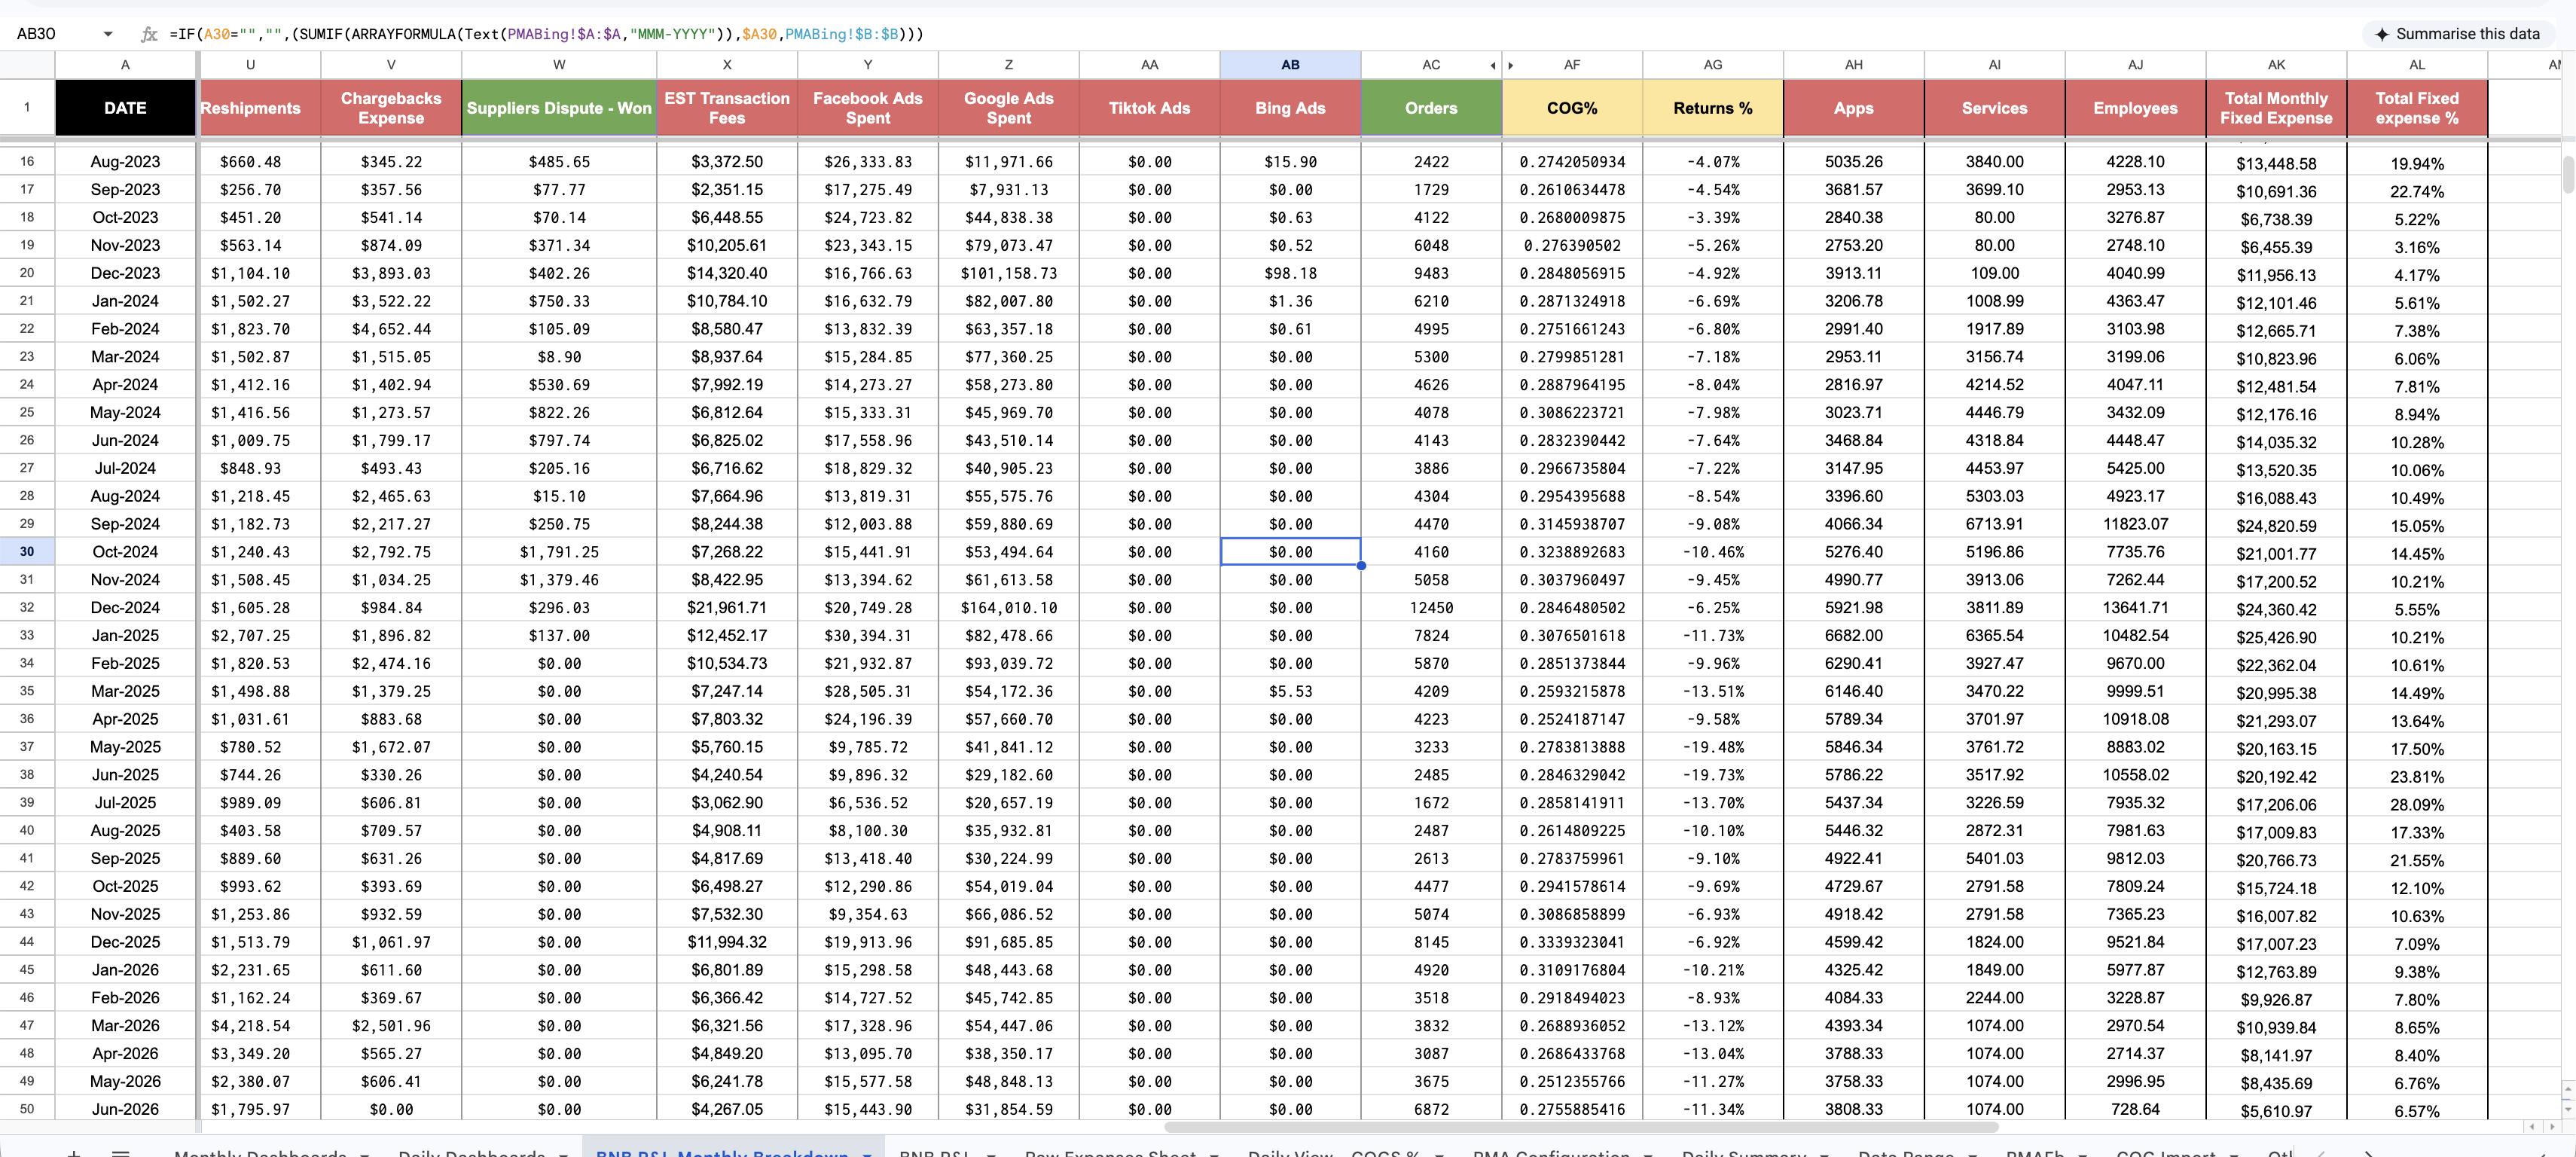
The costs that quietly decide whether a month is profitable — reshipments, chargebacks, won and lost supplier disputes, transaction fees, apps, services and employee costs — each get their own tracked column, rolled into the monthly breakdown alongside spend from all four ad platforms.
Impact
From end-of-month surprises to daily course-correction.
- Hitting a monthly target became simple math. With profit-per-order calculated daily, a monthly goal turns into X orders a day at current margins. Miss a day, and the dashboard shows the new number needed to catch up.
- Break-even ROAS became a known number. Knowing true daily costs meant knowing the exact ROAS below which a campaign loses money — so scaling and cutting decisions took minutes, not meetings.
- When profit dips, the lever is visible. The dashboard shows which line moved — COGS creeping, returns spiking, one channel bleeding, chargebacks rising. The thing to fix is visible, not guessed.
- $1.4M+ in sales tracked in a single view, across 2 marketplaces and 4 ad platforms, with zero hours spent building reports by hand.
Tools & Technologies
P&L Setup & Dashboard
Everything tracked — gross sales, ad spend, COGS, fees, chargebacks, ROAS, real profit. Know what you actually made yesterday.
Learn more